There’s no ironclad formula, but it stands to reason that the more user-friendly a computer interface, the more effort went into creating it. Put another way: The designers grappled with the difficult issues up front—so the user won’t have to.
This summer, four students from the Georgetown University Master’s in Information Technology Management program went a long way toward proving that axiom by taking on an intensive project called the Tableau Student Data Challenge as part of their final project, or Capstone.
Dividing into two teams of two students each, the participants had just eight weeks to create a dashboard that responded to one of two challenges: 1) Identify the top causes of homelessness and relate these to issues such as housing costs, health condition, and overall income level; or 2) Create a tool that helps veterans analyze and measure the advantages and availability of educational programs covered by the GI Bill®.
“What did we learn from this first iteration? That complex problems—such as understanding the homeless issue or delineating the many higher-education opportunities available for veterans—rarely have simple solutions,” said Maria Trujillo, former faculty director of the Technology Management program.
“Just stating the problem is a challenge in itself,” Trujillo said. “The fact that these teams were successful in meeting both the academic and nonacademic requirements of this project is quite an accomplishment.”
A Tool for Decision-Making
The partnership between Georgetown and Tableau Software is the result of a meeting Trujillo had with a representative from the Seattle-based company in October 2018. After discussing several ways in which the two could collaborate they decided on group projects that could be woven into the students’ Capstones.
Today’s computer dashboards are sleeker and more attractive than those in the past, but their benefits go beyond aesthetics, Trujillo said.
“Visualizing the data doesn’t just mean seeing it in a different way,” she said. “It enables decision-making in a way it couldn’t before.”
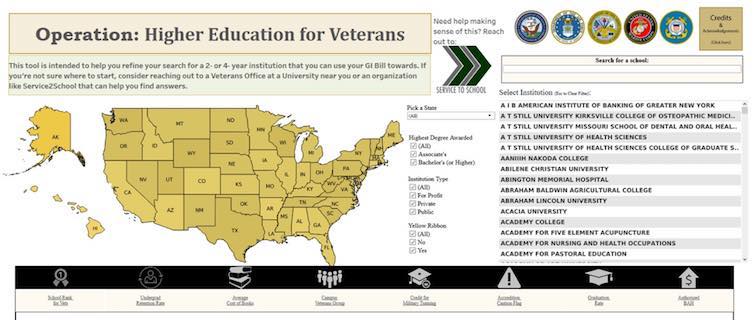
The project on veterans’ education benefits was done by Ramsay Bohm and Kidan Berhanu. Their goal was to help veterans choose colleges that would be a good fit for their interests and experience. Before starting, they reached out to the Veterans Services offices at Georgetown and at the University of Wisconsin-Madison (where Bohm works) to confirm that veterans did indeed have trouble finding relevant information about schools.
“The Department of Veterans Affairs has a lot of information, but it’s very difficult to find information on a program,” Berhanu said. “Also, it wasn’t very user-friendly.”
Their dashboard includes multiple ways to search and filter colleges by name, degrees offered, state, and status within the Yellow Ribbon Reintegration Program for members of the natural guard and reserves. The team also tapped other data sources, including university and college rankings from “U.S. News & World Report,” data provided from the nonprofit Service2School program, and location data gathered from Google Maps.
A Complex—but Solvable—Problem
The project on homelessness was completed by Pia Rahman and Christopher Semkow. They not only provided statistics on homelessness in various jurisdictions of Virginia, but also highlighted social and economic factors that may cause homelessness in a given locality.
“If statistical causes for homelessness were better understood and documented, most of which are related to social factors, preventive measures could be taken to mitigate risk factors—not just treat the problem but prevent it,” the team wrote.
Semkow, who is from Fairfax County, Virginia, said it is important to parse out what factors in a given jurisdiction may be contributing to homelessness because the relative significance of these factors varies by locality.
“Every county is as unique as every individual,” Semkow said. “And one county’s contributing factors could be completely different than for another.”
In economically strong Fairfax, for example, unemployment is not as big an issue as it might be in a poor rural area. Instead, homelessness is largely driven by the high cost of living.
For all the difficulty involved in this complex project—including simply defining homelessness in the face of multiple definitions—creating a system that points to some of its specific causes gave Semkow and Rahman reason for hope.
“It seems not that difficult to solve,” Semkow said. “It’s doable.”
Learn more